On 10 April 2013 I wrote an article that was published on this blog called ‘Good guys, bad guys and Content Marketing’.
A week later someone in the USA searched Google.com with the keywords ‘cowboy-harmonica-baddies’ and found their way to the page through the organic results. Evidently they weren’t very impressed as they left the page after just eight seconds. (Perhaps not surprising - I didn't write about harmonicas.)
The two other Americans to have visited the page (both Twitter referrals) were slightly more enamoured with us, spending an average of two minutes and thirty seconds on the blog entry before continuing to another part of the Webreality website.
How do we know all this? Because we use Google Analytics.
Web analytics tools like Google Analytics allow webmasters to access a horde of information about the way their website is used. From page hits and referrals to audience geography and bounce rates, packages such as Google Analytics provide an extensive platform of statistical reports that help us to analyse the effectiveness of our website, test and implement new strategy and define new objectives.
But why are we so interested in you?
Well, without prompting visions of the totalitarian dystopia of ‘Nineteen Eighty-Four’, it’s important for us to know what you are thinking.
Like every visitor to this site you are a potential or existing Webreality customer and understanding your behaviour in finding and using our site is essential for us to improve the effectiveness of our online marketing.
Just to start we can use analytics tools to optimise the search keywords you used to find us, identify the search engines and social media platforms that referred you here and pinpoint the content that is proving popular enough for you to read and re-distribute.
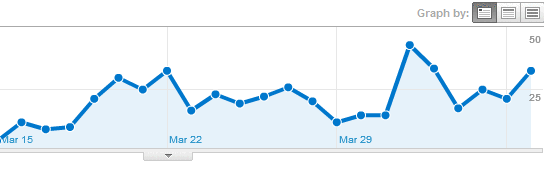
Here are some analytic observations on the exposure of the ‘Good guys, bad guys...’ blog in the 30 days after it was published:
- The page was viewed 71 times
- 51 views occurred on the day of publication
- Visitors spent an average of 6 minutes and 10 seconds on the page
- 68.42% of page visitors left without exploring any other part of the website
- 39 visitors were referred to the page from a Social Media channel
- 44 visitors used the Google Chrome browser
- 60% of views on mobile devices were from iOS, the rest from Android.
Here are example of questions that these statistics should lead us to ask ourselves:
- Why did the page footfall drop so quickly after day one?
- How do we get visitors from the blog pages to visit other parts of the site?
- When they do continue to other parts of the site, where do they go and why?
- How does the blog look when you view it on Google Chrome?
And some conclusions:
- Given interesting content, visitors will spend time reading an article.
- Social Media is a massive contributor to our marketing effort.
These are just some of the figures that analytical study allows us to decipher before attempting to make changes to our site that benefit user experience and our exposure as a business.
In the coming weeks I’ll write more reviews of the analytical fortunes of the Webreality blog to illustrate the sheer abundance of information at hand.
More often than not, analytics simply allows us the clarity to reach logical conclusions - suppose the vast majority of our Facebook referrals come after 6pm, perhaps we should experiment with sharing our content at tea-time?
It all makes sense, but you won’t realise until you take a good hard look at the stats.